|
Recently in Sci-Vis we did the SensorTag data collection project. For my project I collected data on humidity. I have to say, the project sounded a lot cooler than it turned out to be, but I had a feeling this would be the case as I do not typically enjoy data collection activities. Usually it my data is always flawed, or doesn't seem to come to the conclusion that it is supposed to based on the design of the experiment. For this however I am referring to experiments pre-planned by teachers in order to come to specific results in order to teach a lesson. For instance, doing an experiment from a worksheet called "Photosynthesis In Action!" where you count the number of bubbles a water plant produces in different predetermined amounts of light to show that light affects photosynthesis. It was nice to finally do an experiment where my hypothesis wasn't as much of a I think it will work or I think it won't, but was actually a stand alone statement that could be proven or disproved. The experiment was picked by my partner and I (I know it's kind of lame, we chose the first idea we had due to lack of time,) and so we were able to chose what we wanted to learn about. The data, not the teacher, determined what we learned about that topic (humidity). This is more accurate to how real world experiments would be in most cases. Though your topic may be picked by whoever funds you, it would be the experimenters designing the experiment, and interpreting the data. It was more enjoyable than most data collection I've done previously.
However, I found the limitations of the SensorTag very annoying. There was not a wide variety of experiments that we could plausibly conduct within the time frame. The data readings also seemed very inaccurate and I got fairly frustrated that my data wasn't proving or disproving my hypothesis, as was normal for school experiments. I seem to usually get ambiguous data and that is a problem for worksheets teaching you basic science principles. However, after re-examining my data, I realized that though my hypothesis of smaller more isolated spaces having a higher humidity wasn't proved, the data did show that the outdoor humidity greatly affects the indoor humidity. For this assignment, coming to a different conclusion that what I was originally looking for was okay, as long as I addressed the flaw in my original thought. My data still might have been flawed, but I used what I had and hoped that it was at least partially correct. The research paper wasn't too lengthy or tedious, and helped practice with excel. Making an infographic for the data was a nice piece of this assignment too, as it gave me more practice at focusing more on the graphic part since I tend to include too much info. I've heard a lot of people say this part was more stressful than data collection for them, but I wish I had had more time for the latter, and the same amount or a bit less time for the former. I am also excited about presentation. While a lot of people's conclusions will surely be similar since we worked in partnerships, I think it will be nice to present in front of the class to see peer work, and to find out the outcomes of others'experiments. While there wasn't an incredibly wide range of experiments to try, it will be interesting to see what other research we could have done, and if any people who did the same experiment as us reached different conclusions. All in all, it was a good experiment since we got to use an interesting piece of technology and basically had free reign within the hardware's limitations of what we were going to do for out project. I think that having more freedom of choice as a student is very nice. If you couldn't already tell, I have never really considered careers with a lot of experimentation as a career option since I have never liked experiments at school. However, because of the SensorTag Project, despite the flaws it does have, I feel a little more open towards those kinds of careers. With better technology and/or more time to work, I feel like I might not feel so hostile towards experiments. I liked how big of a role data analysis played in the project where we could reach any conclusion, not a preset one. It didn't exactly teach much new material, but it did clarify past lessons and give us practice at collecting data, analyzing it and making a chart for the data, which was useful. If I could change one thing it would be having a bit more time to experiment. I understand that too much time could lead to people slacking off, but I felt overly rushed, and would have actually enjoyed getting to explore a little further across campus.
0 Comments
Energy is a bigger problem in first world countries than third world countries, but in most places some form of energy is being used. It would be wonderful to get reliable sources of energy to anywhere in the world so that people could access the internet for education, have heating or cooling, and even just having electric lights in their homes so they can stay up later if they wish. However, it is no secret that the main source of our energy, fossil fuels, are not very renewable resources. If we want to continue having power for our homes, cars, and anything else, we need to find a more efficient source of energy than dead dinosaurs. However, new research suggests that running out of fossil fuels isn't what's going to undo us in the end. 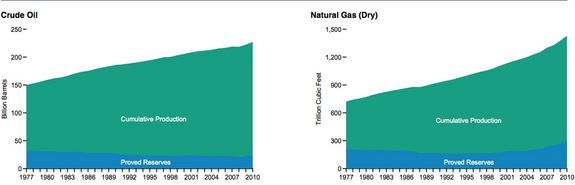 This graph shows how the US production of oil and natural gas has not greatly affected the remaining amount of those resources. There is enough of each left that we aren't that close to running out of it. However, there are still ill-effects. The emissions from all of the fuels have caused a great deal of climate change. Since there isn't as much pressure on changing to other fuels since there is still a good amount of ancient materials, not much is being done to stop using fossil fuels. Any change will be driven by the need to stop global warming rather than lack of fossil fuels. While we all are aware of the impending doom climate change could bring (flooding, extinction of many organisms, lack of oxygen, etc.) not much is being done about it. The US's energy consumption is only growing, and clean sources of energy are not used very much. Most clean energy sources are deemed too expensive, or impractical. Solar panels are very costly, and not everyone has the space to put a wind turbine up in their yard. To solve this problem, finding a cheaper, cleaner source of energy would be crucial. This would require further knowledge of why clean energy sources are so expensive (cost of materials, and how energy companies that would lose money to the clean sources play into this). Also, to create this clean energy, knowing engineering could greatly help. It could allow you to find more efficient ways to make solar panels that cost less and collect more energy. Personally to solve this problem, I could try to get the school to invest in solar panels. Even just using the SensorTag (if I had access to the roof) I could conduct an experiment to see if it would be worth it for the school to put up the panels. I would need to know how much sunlight solar panels need to produce a certain amount of energy, the cost per panel, as well as the school's total energy consumption, and area of the roof. With this knowledge I could conduct an experiment with the hypothesis "If the school invests in solar panels, then they will burn less fossil fuels, and in the long run, save money." The independent variable would be how much sunlight hits the roof throughout the day, and the dependent variable would be how much energy the school would make from said sunlight, and how much money they could cut off of the energy bill. It would be important to pay attention to how much the panels would cost, because you wouldn't want the school to be in debt because of solar panels. This could give the clean source of energy a bad reputation, even though it is likely the school would be paid back in the amount they saved on energy because of the panels. While clean energy should be used regardless of the cost because of how beneficial it is, people have their best interests in mind. The money aspect of the above experiment is more so to convince the school to install solar panels than to gain profit. The school has tons of lights that seem to constantly be on (I've seen the school at around 7pm on a Saturday while driving by and most of the buildings were lit up like Christmas despite most likely being empty). The amount of energy used must be huge, and although it is being used for tons of people at once and more efficient than everyone having their own lights (sort of like carpooling) we could be even more ecofriendly by using solar power. Sources:
For the past week or so in Scientific Visualization, in keeping with our data unit, we have been preparing to experiment, and we have gotten to test out the TI Sensor Tag. The tag seemed really cool, and I was excited to try it out. My group and I went around the classroom, mainly testing out the light sensor using the heat lamps from the pet lizard’s cage, and looking at different temperatures of people’s faces and the lights. However, I was sort of underwhelmed with the sensor. I didn't feel like it was as capable as it had been described.The graphs were inconsistent since the changes were so large, and it was difficult to compare data based off of just the graph. Looking at the numbers was pretty interesting, but I am glad that we only had a short time for initial testing or else I would have gotten bored very quickly.
We’re going to have to conduct an experiment around campus using the tags, but we get to choose what we would like to collect data on. Some basic experiments involve collecting temperature, humidity, and light readings from different rooms and comparing them. Based on the standards the school wants, this could help them to determine which classrooms most direly needed their thermostat adjusted or fixed, or which light bulbs should be replaced. Combining a few factors in an experiment could serve as fuel for a more complex experiment. Comparing how the light and humidity levels in different classrooms affect heat for instance could also help the school determine what improvements could be made to upkeep and ideal temperature. Though impractical because of location, if we were to put a sensor on the roof, we could even see if solar panels would be a good investment for the school. The motion sensor could be used in experiments, but will likely be less useful for helping the school, and would more likely be frivolous. However, things as easy as comparing the temperature of benches around the school to the amount of shade in the area (or the light level) could aid the school by helping them decide where to place benches so that they aren’t too hot or cold to sit on. (This is sidetracking just a bit.) One experiment that is impractical, but would be fun is to see how many times other group members would press the button on the sensor. Since the data is tracked, if you were to also keep track of what location you were in, you could see how they correlated. It would be more of a just for fun experiment, possibly a psychology experiment, but would not help the school. The only way I could think that it might is if the button pressing was restlessness, then you could see in which places students were less focused. Otherwise, the experiment is pretty much useless. It would have to be done under false pretenses so that the group members holding the sensor would not know that the number of times that they pressed the button were being recorded. You would also have to make sure that the entire group knew that there was a button that they could push that wouldn’t turn the sensor off. However, this also could go wrong if someone hit the power button by accident during the experiment if they got into the habit of pressing the button when they were bored, just because it was there. Also, if the group avoided pressing the button, you wouldn’t have any concrete data to work with. (Slight sidetrack over.) There are other experiments that could be conducted, but would require extra data collection besides just what the Sensor Tag would gather. For instance, to see whether or not humidity increases with more people in a classroom would require measuring humidity with the sensor, as well as taking a head count. While this wouldn’t be too incredibly difficult, if we were to compare humidity to the size of a classroom, doing the manual calculations for floor space may be more time consuming. This is one example of how the tag’s capabilities could limit what experiments we could conduct. Another limitation is the software forcing to cooperate. When using the sensors for the first time, we had at least five in use at once trying to connect. It was difficult to determine which tag was which when connecting, as they are named in numbers and their name is not indicated on the tag (as far as I could tell). Some people’s phones wouldn’t connect, or the app wouldn’t open at all. Once I got the tag connected, the motion sensor still didn’t want to work, and we are unable to use the microphone. It felt as if all I could monitor was light, temperature of either the room or objects, humidity, pressure, and whether or not someone was pressing a button. While this is a wide variety of sensors, it is only about half of the ones that were mentioned. I did not notice whether or not the magnetic sensors were working, so my options may be a bit broader than I originally expected. The biggest limitation currently is that the app does not store the data anywhere. While it is cool to watch the line graph go up and down, without a way to record data, it is not very useful. I am not sure how we are going to overcome this obstacle. For some experiments, simply writing down a number with pen and paper might be fine, but in others the data will change too rapidly and the trend will be too important for this to be practical. Also, trying to record multiple variables at once could serve as another problem with written data. I have a feeling there is a way to export the data as you collect it, or to connect the device to a different machine that can record it, but if there is we have not been told about it. If there isn’t, this will further limit the possibilities for experiments, since the best option would be to write things down. Hopefully there will be an easy way to record data so that we are able to do interesting experiments, and come to some sort of conclusion from them. In Scientific Visualization, we will soon be using a tool called the TI SensorTag. Prior to using it, we have been assigned to do research on the tool, and on sensors in general, as well as how they can be used in school, and in the real world.
A sensor is any device that detects or monitors something. There is a wide variety of sensors from microphones to sensors that measure depth in water. This data can be taken from the device, and then analyzed. The TI SensorTag we are using contains ten different sensors, allowing the tag to measure light, sound, humidity, pressure, object temperature, ambient temperature, magnetic forces, movement, and speed. The data is then sent to a paired phone or similar device, where it can be recorded. An example of sensors being used in the real world is with cars. Automobiles have speedometers to let you know what speed you are traveling at in order to stay within safety limits, and newer vehicles have other safety sensors such as cameras or motion sensors to check whether or not there are other vehicles nearby. When making, or fixing cars, sensors can also be used. How noisy a car is may be considered while it is in the design stages, and things such as tire pressure may be measured on a regular basis. Sensors can also be useful in the health world. Certain germs and enzymes function better in certain environments. For instance, if the enzyme catalase, found in the liver, is cooked at a certain temperature, it will no longer break down hydrogen peroxide. While knowing this specifically may not be the most useful information, if professionals study which environments germs can and can't live in, we can have better knowledge of how to sterilize medical tools and surfaces. Another example is measuring environmental factors. Scientists can record the chemical makeup of bodies of water to make sure that the levels of dissolved oxygen are balanced, and that the pH isn’t too high or low. By tracking different chemicals, they can also assess what nutrients are more crucial to different organisms of that ecosystem. This is useful for us to learn about how to protect the environment by not putting too much of certain chemicals into the water. At school, we can use the TI SensorTag in order to collect data and learn how to analyze and organize it, as we will be doing in Sci Vis. However, it could also be a useful asset for biology, as everyone could create a miniature ecosystem (or a terrarium), put the sensor inside, and collect data from the model. Then, through comparing the data, a class could learn what factors make one ecosystem more successful than another. They could also collect data outside, and compare it to data in other climates that they could find through research. Though it may be too much work, it could be useful in math class as well, allowing for the collection of real life data. The sensor is a nice tool because students are more likely to be engaged with their work when they have collected the data themselves, rather than just seeing random numbers on a page. Most of the data that you would collect from the TI SensorTag would best be displayed on a line graph, as it would show the change of different factors overtime. Ambient temperature, humidity, pressure, and light would all be best measured on line graphs because you could easily compare the trends of each factor, even in multiple environments at once. Movement and speed would be best shown on line graphs as well, as you would want to track how speed changes overtime, as well as when movement was greater. However, object temperature, as well as magnetic force, would best be displayed on a bar graph, because you could compare the temperatures and forces of different objects or areas. While there may be some change in these factors, it is more likely that the trend of these variables won’t be very important, and it would be more useful to compare an initial reading from one area or object. This is not always the case though, since sometimes you do want to see the trend of this data, such as how the ground temperature changes throughout the day. Then the data would also be best displayed on a line graph. Measuring environmental data can provide students a more thorough understanding of how different factors affect us and other organisms. On a more basic level, we could see how the environment often changes throughout the day, and we could compare the climate of the local area to other climates. It will also teach us how to interpret raw data, how to organize it in a way that is more readable, and how to make conclusions based off of the information put in front of us. As mentioned above, being able to use a sensor to collect data ourselves will likely be more interesting that having the computer spit a jumble of random numbers out at us for us to interpret. So, overall, the scanner could make us more knowledgeable about the environment, more engaged in our work, and better at deciphering and organizing data. |
